- English (UK)
- English (India)
- English (Canada)
- English (Australia)
- English (South Africa)
- English (Philippines)
- English (Nigeria)
- Deutsch
- Español (España)
- Español (México)
- Français
- Italiano
- Nederlands
- Polski
- Português (Portugal)
- Português (Brasil)
- Русский
- Türkçe
- العربية
- Ελληνικά
- Svenska
- Suomi
- עברית
- 日本語
- 한국어
- 简体中文
- 繁體中文
- Bahasa Indonesia
- Bahasa Melayu
- ไทย
- Tiếng Việt
- हिंदी
ASML Holding NV ADR (ASML)
ASML Holding NV ADR stock price live, this page displays NASDAQ ASML stock exchange data. View the ASML premarket stock price ahead of the market session or assess the after hours quote. Monitor the latest movements within the ASML Holding NV ADR real time stock price chart below.
What Is the ASML Holding NV ADR Stock Price Today?
The ASML Holding NV ADR stock price today is 1,479.42.
What Is the Stock Symbol for ASML Holding NV ADR?
The stock ticker symbol for ASML Holding NV ADR is ASML.
Is ASML the Same as $ASML?
$ASML is a common way to refer to the ASML Holding NV ADR ticker symbol in social media, forums, and online discussions. The dollar sign is a shorthand convention used to indicate that it is a stock ticker symbol
What Stock Exchange Does ASML Holding NV ADR Trade On?
ASML Holding NV ADR is listed and trades on the NASDAQ stock exchange.
Is ASML Holding NV ADR a Good Stock to Buy?
Determining whether ASML Holding NV ADR—or any stock—is a good buy requires comprehensive analysis. To evaluate its potential, users can sign up to InvestingPro, where they can assess the current ASML Holding NV ADR share price compared with the fair value and other essential metrics.
You can find more details by visiting the additional pages to view historical data, charts, latest news, analysis or visit the forum to view opinions on the ASML quote. (ISIN: USN070592100)
NASDAQ
Symbol | Exchange | Currency | |||
|---|---|---|---|---|---|
| ASML | · | NASDAQ | · | USD | |
| ASMLa | · | BATS Europe | · | EUR | |
| ASMLF | · | OTC Markets | · | USD | |
| 0M42 | · | London | · | USD | |
| 0QB8 | · | London | · | EUR | |
| ASMLN | · | BIVA | · | MXN | |
| ASML1N | · | BIVA | · | MXN | |
| ASMLN | · | Mexico | · | MXN | |
| ASML | · | Milan | · | EUR | |
| ASML | · | Switzerland | · | CHF | |
| ASME | · | TradeGate | · | EUR | |
| ASMFy | · | TradeGate | · | EUR | |
| ASME | · | Xetra | · | EUR | |
| ASME | · | Frankfurt | · | EUR | |
| ASML | · | Amsterdam | · | EUR | |
| ASML34 | · | B3 | · | BRL | |
| ASML | · | Warsaw | · | PLN | |
| ASMN | · | Vienna | · | EUR | |
| ASML | · | Vienna | · | EUR | |
| ASML | · | Lima | · | USD |
Currency in USD
1,484.55
-33.75(-2.22%)
Real-time Data·
Fair Value
An estimate of a stock's true price based on valuation models like discounted cash flow, peer valuation multiples, and dividend discount models.
Day's Range
1,415.25
1,486.17
52 wk Range
614.06
1,547.22
Earnings results expected today
1/3
Fair Value
An estimate of a stock's true price based on valuation models like discounted cash flow, peer valuation multiples, and dividend discount models.
Day's Range
1,415.251,486.17
52 wk Range
614.061,547.22
Key Statistics
Edit
Prev. Close
Open
Volume
Average Vol. (3m)
1-Year Change
Book Value / Share
Fair Value
Fair Value Upside
Market Cap
Shares Outstanding
Revenue
Net Income
EPS
EPS Growth Forecast
Next Earnings Date
(0.49%)
Dividends Payment Streak
P/E Ratio
Return on Assets
Return on Equity
Gross Profit Margin
Price/Book
EBITDA
EV/EBITDA
Beta
ASML Scorecard
Company’s Health
Assesses a company's financial position by analyzing its market value, financial ratios, industry benchmarks, and competitors.
UnlockFair Value
An estimate of a stock's true price based on valuation models like discounted cash flow, peer valuation multiples, and dividend discount models.
Unlock PriceTechnical Analysis
Strong Buy
Analysts Sentiment
Strong Buy
Price Target
1,510.35
Upside
+1.74%
Members' Sentiments
Bearish
Bullish
ProTips
Tips that distill complex financial data into concise, actionable investment insights.
Trading at a high P/E ratio relative to near-term earnings growth
- ASML Holdings receives Investment Bank Analyst Rating Update
- Investing.com
Pro - Asml Holding receives Investment Bank Analyst Rating Update
- Investing.com
Pro
- ASML Holdings receives Investment Bank Analyst Rating Update
- Investing.com
Pro - Asml Holding receives Investment Bank Analyst Rating Update
- Investing.com
Pro
Technical Analysis
Summary
Strong Sell
Sell
Neutral
Buy
Strong Buy
Neutral
Technical Indicators
Sell
Moving Averages
Strong Buy
ASML Holding N.V. provides lithography solutions for the development, production, marketing, sales, upgrading, and servicing of advanced semiconductor equipment systems. The company offers lithography, metrology, and inspection systems. It also provides extreme ultraviolet lithography systems; and deep ultraviolet lithography systems comprising immersion and dry lithography systems solutions to manufacture various range of semiconductor nodes and technologies. In addition, the company offers metrology and inspection systems, including YieldStar optical metrology systems, a diffraction-based wafer metrology platform to assess the quality of patterns on the wafers; and HMI electron beam solutions to locate and analyze individual chip defects. Further, it provides computational lithography solutions, and lithography systems and control software solutions; and refurbishes and upgrades lithography systems, as well as offers customer support and related services. Additionally, the company offers hardware, software, and services to chipmakers to produce the patterns of integrated circuits. It operates in Japan, South Korea, Singapore, Taiwan, China, rest of Asia, the Netherlands, rest of Europe, the Middle East, Africa, and the United States. The company was formerly known as ASM Lithography Holding N.V. and changed its name to ASML Holding N.V. in 2001. ASML Holding N.V. was founded in 1984 and is headquartered in Veldhoven, the Netherlands.
ASML Holding NV ADR SWOT Analysis
Geopolitical Risks | Analyst price targets range from €650 to €930, reflecting optimism despite potential headwinds from export restrictions and global trade tensions |
AI-Driven Growth | Learn how the AI boom is fueling demand for ASML's cutting-edge equipment, positioning the company at the forefront of technological innovation |
Financial Prowess | Delve into ASML's robust financial health, with projected revenue CAGR of 19% and expanding operating margins, showcasing its market leadership |
EUV Dominance | Explore ASML's near-monopoly in EUV lithography, driving semiconductor advancements and solidifying its crucial role in the global chip supply chain |
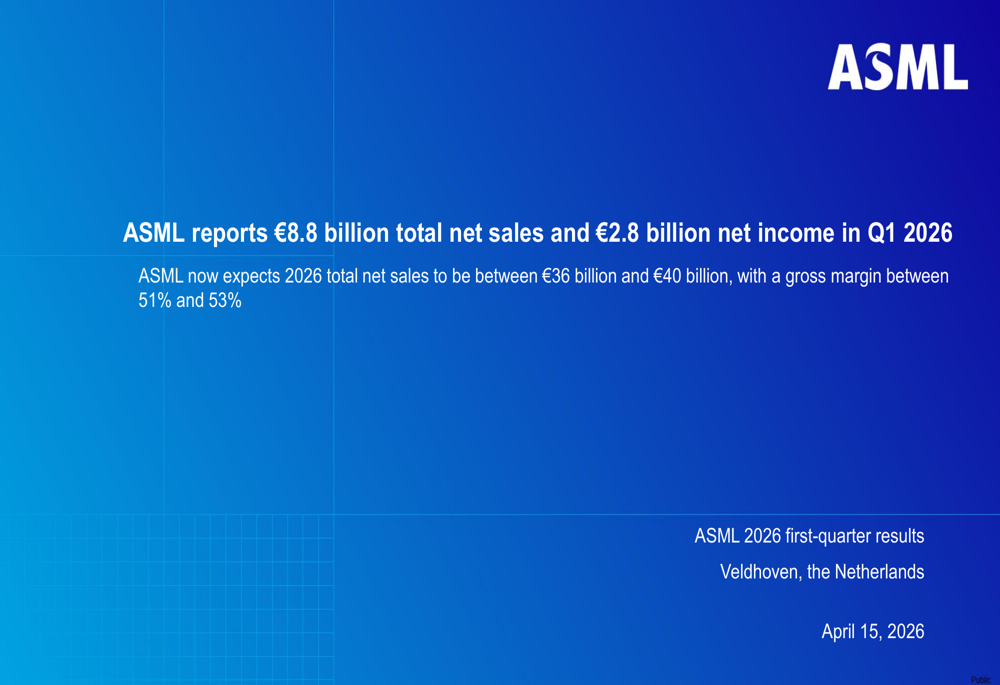
ASML Holding NV ADR Earnings Call Summary for Q1/2026
- ASML reported Q1 2026 net sales of €8.8B with 53% gross margin, raising full-year guidance to €36-40B from prior estimates.
- Net income reached €2.8B as strong EUV and DUV technology demand drove performance; stock rose 1.66% in premarket trading.
- Q2 2026 revenue guidance set at €8.4-9.0B with 51-52% gross margin; installed base revenue of €2.5B exceeded expectations.
- Management expressed confidence navigating export controls; memory and logic customers accelerating capex and capacity ramps support growth.
- Stock trading near 52-week high of $1,547, up 147% from low, though InvestingPro analysis suggests current overvaluation concerns.
Last Updated: 04/15/2026, 01:26 AM
Read Full TranscriptASML ADR investor slides for Q1/2026
Last Update: Apr 15, 2026
See full investor slides
Compare ASML to Peers and Sector
Metrics to compare | ASML | Sector Sector - Average of metrics from a broad group of related Technology sector companies | Relationship RelationshipASMLPeersSector | |
|---|---|---|---|---|
P/E Ratio | 49.3x | 50.8x | 12.7x | |
PEG Ratio | 1.81 | 0.60 | 0.01 | |
Price / Book | 24.2x | 6.6x | 2.4x | |
Price / LTM Sales | 14.5x | 8.3x | 2.3x | |
Upside (Analyst Target) | 6.4% | 7.5% | 26.9% | |
Fair Value Upside | Unlock | −14.7% | 3.4% | Unlock |
Analyst Ratings
37 Buy
6 Hold
1 Sell
Ratings:
44 analysts
Overall Consensus
Strong Buy
Analysts 12-Month Price Target:
Average 1,510.35
(+1.74% Upside)
Earnings
Latest Release
Apr 15, 2026
EPS / Forecast
8.26 / 7.70
Revenue / Forecast
10.13B / 8.66B
People Also Watch
FAQ
What Is the ASML ADR (ASML) Stock Price Today?
The ASML ADR stock price today is 1,484.55 USD.
What Stock Exchange Does ASML ADR Trade On?
ASML ADR is listed and trades on the Nasdaq Stock Exchange.
What Is the Stock Symbol for ASML ADR?
The stock symbol for ASML ADR is "ASML."
Does ASML ADR Pay Dividends? What’s The Current Dividend Yield?
The ASML ADR dividend yield is 0.49%.
What Is the ASML ADR Market Cap?
As of today, ASML ADR market cap is 558.41B USD.
What Is ASML ADR's Earnings Per Share (TTM)?
The ASML ADR EPS (TTM) is 24.71.
When Is the Next ASML ADR Earnings Date?
ASML ADR will release its next earnings report on Apr 15, 2026.
From a Technical Analysis Perspective, Is ASML a Buy or Sell?
Based on moving averages and other technical indicators, the daily buy/sell signal is Strong Buy.
How Many Times Has ASML ADR Stock Split?
ASML ADR has split 5 times.
How Many Employees Does ASML ADR Have?
ASML ADR has 43520 employees.
What is the current trading status of ASML ADR (ASML)?
As of Apr 15, 2026, ASML ADR (ASML) is trading at a price of 1,484.55 USD, with a previous close of 1,518.30 USD. The stock has fluctuated within a day range of 1,415.25 USD to 1,486.17 USD, while its 52-week range spans from 614.06 USD to 1,547.22 USD.
What Is ASML ADR (ASML) Price Target According to Analysts?
The average 12-month price target for ASML ADR is 1,510.35 USD, with a high estimate of 2017.05351065 USD and a low estimate of 912.43101277 USD. 37 analysts recommend buying the stock, while 1 suggest selling, leading to an overall rating of Strong Buy. The stock has an +1.74% Upside potential.
What Is the ASML Premarket Price?
ASML's last pre-market stock price is 1,474.58 USD. The pre-market share volume is 495,320.00, and the stock has decreased by -43.72, or -2.88%.
What Is the ASML After Hours Price?
ASML's last after hours stock price is 1,531.13 USD, the stock has decreased by 12.83, or 0.85%.
Install Our App
Risk Disclosure: Trading in financial instruments and/or cryptocurrencies involves high risks including the risk of losing some, or all, of your investment amount, and may not be suitable for all investors. Prices of cryptocurrencies are extremely volatile and may be affected by external factors such as financial, regulatory or political events. Trading on margin increases the financial risks.
Before deciding to trade in financial instrument or cryptocurrencies you should be fully informed of the risks and costs associated with trading the financial markets, carefully consider your investment objectives, level of experience, and risk appetite, and seek professional advice where needed.
Fusion Media would like to remind you that the data contained in this website is not necessarily real-time nor accurate. The data and prices on the website are not necessarily provided by any market or exchange, but may be provided by market makers, and so prices may not be accurate and may differ from the actual price at any given market, meaning prices are indicative and not appropriate for trading purposes. Fusion Media and any provider of the data contained in this website will not accept liability for any loss or damage as a result of your trading, or your reliance on the information contained within this website.
It is prohibited to use, store, reproduce, display, modify, transmit or distribute the data contained in this website without the explicit prior written permission of Fusion Media and/or the data provider. All intellectual property rights are reserved by the providers and/or the exchange providing the data contained in this website.
Fusion Media may be compensated by the advertisers that appear on the website, based on your interaction with the advertisements or advertisers.
© 2007-2026 - Fusion Media Limited. All Rights Reserved.